DP BIOLOGY INTERNAL ASSESSMENT HELP
Research is what I'm doing when I don't know what I'm doing.
-Wernher von Braun
Section Links |
General HelpDP IA LAB CHECKLISTIA RUBRICSExemplarsPeppered moth simulation -- ANNOTATED VERSION (numerical discreet using t-test)
Plasmolyosis of Potatoes --ANNOTATED VERSION (numerical continuous) Ripening of Fruit ----ANNOTATED VERSION (numerical discreet using t-test) Smoke water and Seed Germination --ANNOTATED VERSION (categorical using Chi-sqared analysis) Bio Exemplar- (numerical continuous with linear regression lines) |
TEmplates:
WORD DOCUMENT: HERE
GOOGLE DOCUMENT: HERE
BIO IA PROPOSAL FORM
VaRiables
Variable Definitions
- Independent Variable: The variable you are changing/ testing
- Dependent Variable: The data you are collecting (how will you measure if the IV is working )
- Control Variables: multiple aspects that must remain the same throughout all trials and all IV changes
- Control Group: Negative and Positive controls for IV, these make sure that when you test the IV you are actually testing the IV not some other unknown factor
Independent vs Dependent Variable
|
Choosing your Independent Variable
|
Determining the Dependent Variable
|
Control Variables vs Control Groups
|
Determining Control Variables
|
Control Groups
|
In your Lab report, Do NOT forget:
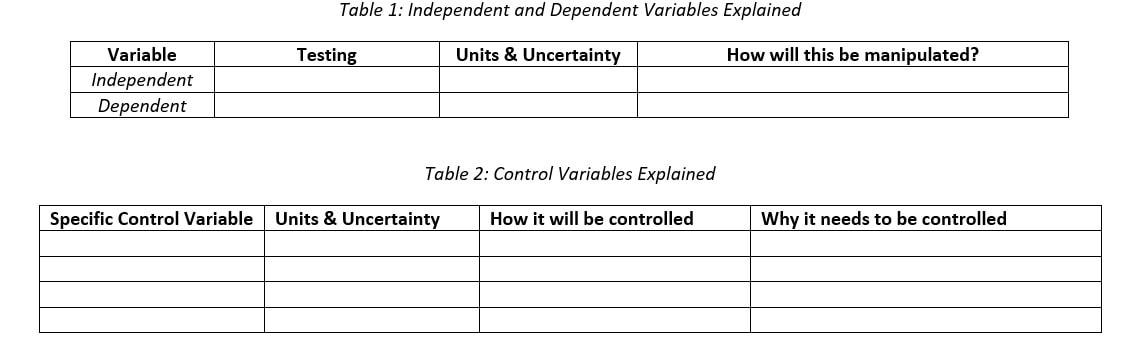
Consider using tables such as these below with your variables. Not required but useful.
- To identify each variable and explain it specifically
- To explain how you manipulate/ control each variable specifically – This includes specific numbers (ex. If I’m controlling temperature (at what temperature will you set it too?)
- To include Units AND Uncertainty* for anything measurable! Obviously if it isn't measureable it doesn't need uncertainty*
Consider using tables such as these below with your variables. Not required but useful.
How to write a Reserach Question
A good scientific research question contains the Independent and Dependent Variable as well as some important control variables.
|
It is possible to make a question too simple or too complicated.
|
Examples:
|
Background Reserach & Hypothesis

https://www.pngkey.com/png/full/655-6550641_lpi-background-information.png
Background information should be relevant to the question and explain the relationship or possible expected relationships between the variables. Make sure to
|

https://www.publichealthnotes.com/wp-content/uploads/2020/04/final-1-678x381.jpg
NOTE: Hypothesis is OPTIONAL!
Your hypothesis can be one well-written sentence. It should sound something like “If...then...because...”.
|
Procedure, Materials, and Safety
https://i.pinimg.com/originals/5e/a2/12/5ea212dd3cec11a2eaf272e4c0a67478.jpg
Your materials list should contain everything needed to carry out the experiment. Generally this should include all materials for all trials, but can include per trial materials. For each material listed:

|

http://femasar.weebly.com/uploads/1/5/3/6/15361694/2793638_1_orig.gif
Safety/ Enviornmental/ Ethical:Generally most experiments have safety concerns. These can be a simple as using a knife to a large as dangerous chemicals and equipment being used. While it is less likely in Biology to deal with dangerous chemicals in high school lab, we are more likely to deal with ethical and environmental concerns.
ALWAYS State the concern and then describe how to reduce the issue.
|
https://thumbs.dreamstime.com/b/procedure-complex-like-puzzle-pictured-as-word-procedure-puzzle-pieces-to-show-procedure-can-be-difficult-needs-164219864.jpg
If you have ever tried to follow a recipe that did not make sense, you will recognize the frustration with writting them. Procedures must balance succinct writting with enough detail to be able to follow the instructions and recreate the lab.
- A numbered list is recommended (Although paragraph form is acceptable in some instances)
- Use command terms with direct instructions (Pour, measure, record, etc)
- Indicate what materials to use when.
- Always indicate how to change the independent variable and
- State when/ how to repeat trials
- ALWAYS, ALWAYS make sure you tell your readers when, where, and how to collect data (both qualitative and quantitative)
- Remember you are writting a recipe not a textbook.
Uncertainty
Measurement Uncertainty
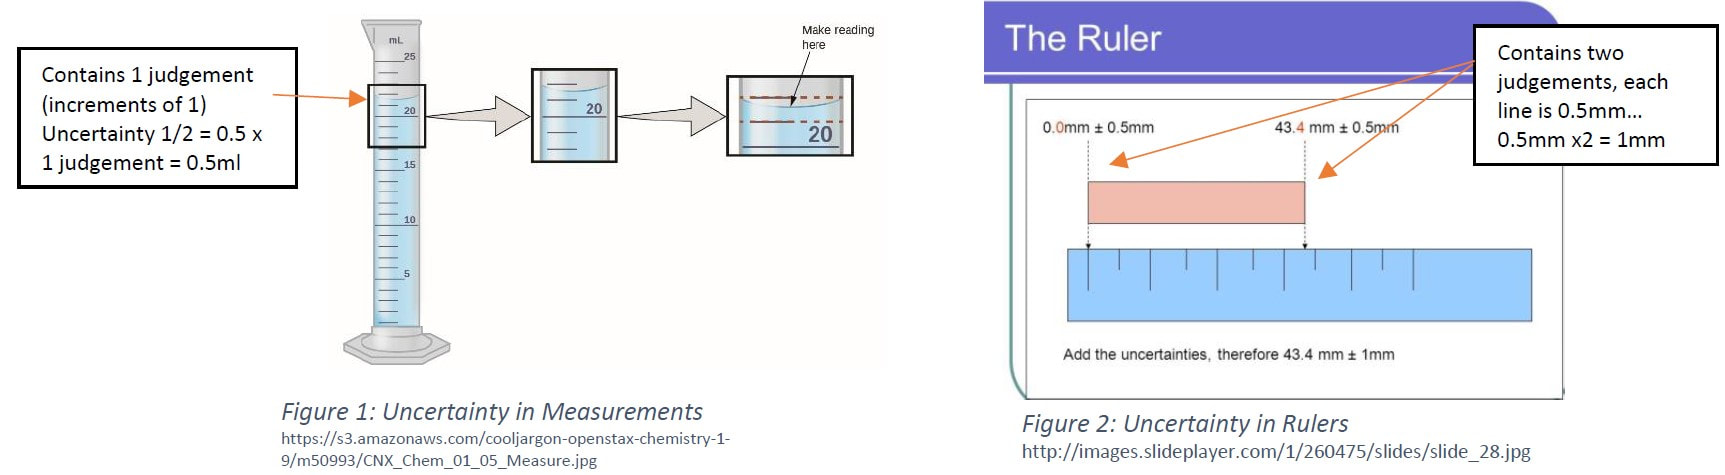
Measurement Uncertainty is the uncertainty that comes with a data point and the instruments used to measure those points.
- Found by taking the smallest increment on a measurement and dividing by 2.
- Example graduated cylinder: each line increases by 1ml, so the smallest increment is 1. 1/2 =0.5. So the uncertainty is +/- 0.5ml
- Rulers are unique in that they actually have two lines of uncertainty. You make a judgement call at both the beginning of the ruler and the end of it.
- As a result the uncertainty is still divided by 2, but with the two lines added together it ends up being mulipled by (effectively canceling the division)

Note that the above examples of the beaker and graduated cylinder, the accuracy of the cylinder is much higher and less likely to causes problems. Always try to elimiate measurement uncertainty by using equipment with the lowest measurement uncertainty.
- This generally means don't use beakers or erlyemeyer flasks to measure anything as they have much higher uncertainties than equipment like graduated cylinders, volumetric flasks and graduated pipettes.
- These uncertainty numbers should be recorded for any equipment or measurement that you have taken. Variables, Materials, Tables, and Graphs.
- Please note that you should NOT put the uncertainty with the numbers but in title headings.
STandard Deviation (STDEV)
Standard deviation is the measure of how far away a group of numbers is from the average.
For how to interpret error bars see "Analysis of data" section below
- Note that you MUST have an average to used STDEV.
- Usually you want at least 5 numbers averaged to make STDEV worth your time.
- The greater the STDEV, the more variation in your data trials and therefore more uncertainty.
- Variation is a good thing generally. As too perfect of numbers can cause doubt about the reliability of the data.
- Too much variation causes overlap with data points causing two points not to be statistically different and no difference in your data sets.
- Note that while STDEV may help you determine reliaibliy of your data points; it does not explain what caused the issues. That is something you must determine and explain in your evaluation.
For how to interpret error bars see "Analysis of data" section below
Tables & Raw Data
Raw data are the numbers that you collect from your procedure AND the observations/ pictures you make along the way.
- Qualitative data = observations
- Quantiative data= numerical data
- Any pictures must have labels with captions "Figure 1: color change after the reaction"
- Figures should always be referenced in the text of your lab. [This includes pictures used to explain the procedure.]
- Always make note of anything out notice or issues that occur, as these observations can be used to support your quantative data conclusions.
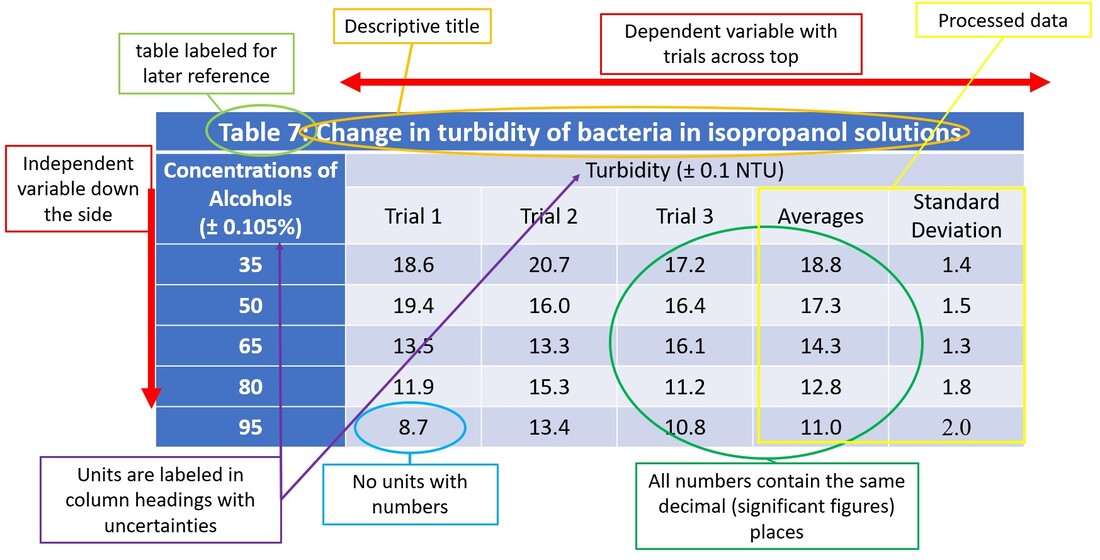
- Rule of thumb: Independent variable down the side, dependent variable across the top
- This can change dependending on how many variables and trials etc, but better to learn to rules before the exceptions!
- All units and uncertainties should be in column headings not with numbers!
- Title and label the table descriptively. Note that "raw data" is not a title.
- Example: Table 3: The change in mass of the orange after being in salt water for 24 hours.
- Note: Raw and processed data can be in one table or separate tables. Depends on how much data and how much processing needs to be done.
Below are a couple of videos made for Pages and Word to help you in this process:
|
|
|
Data Processing
|
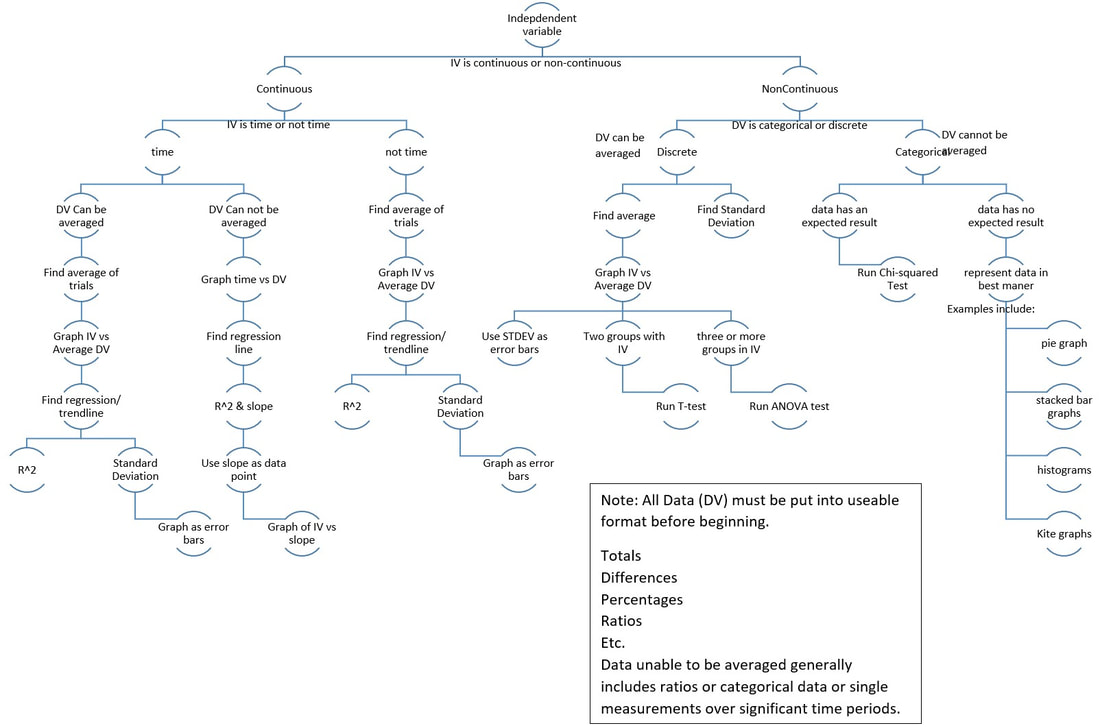
Here is a basic flow chat of what you might do with processed data. Some defintions:
|
|
|
Once you decide how to process your data, time to put it into excel/ numbers to be graphed.
|
Types of graphs by data type:
|
How to do Calculations and Graphs
Using Excel |
Using Numbers |
ALWAYS make sure that your processed data is in a table in your report. (That includes STDEV numbers!).
- Anything you graph or in your graphs must always be present in table forms in your report.
Data Analysis
|
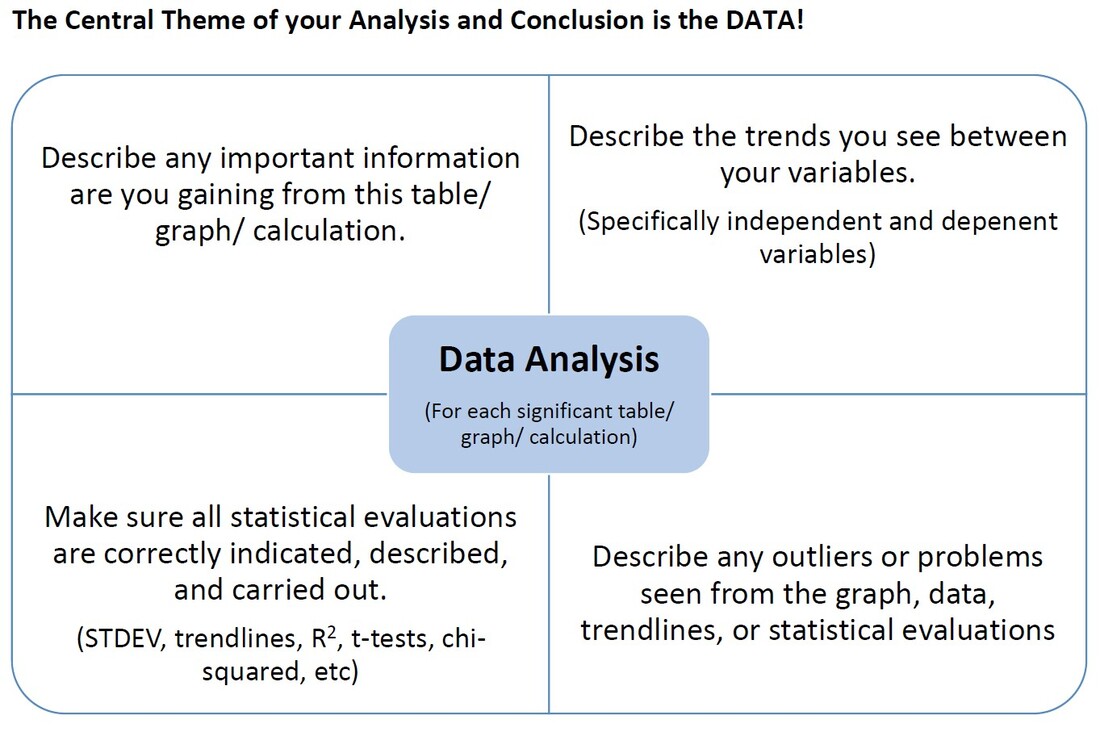
Once you have data processed and graphed, from there you must analyze the data. This is can be done in a separate section of the report or in conjuction with the conclusion. Analysis means looking for:
So how do you analyze?
|
See Statistical Analysis for information on T-tests, Chi-Squared, and ANOVA |
Trendlines & R2 values
- On a scatter plot, create a best fit line/ trendline (a line that gives the general trend of the data)
- make sure your trendline actually fits the data. (ie: if it doesn't look linear don't use a linear line, you can change this using excel)
- With the best fit line, comes an R^2 value.
- R^2 is a measurement of how close your line fits your data
- The closer the number is to 1 the better the fit, and the more reliable the trends conclusion to your data.
- 0.7-1 = strong fit/ correlation
- 0.4-0.6= weaker fit/ correlation
- <0.3 = weak fit
- R^2 is a measurement of how close your line fits your data
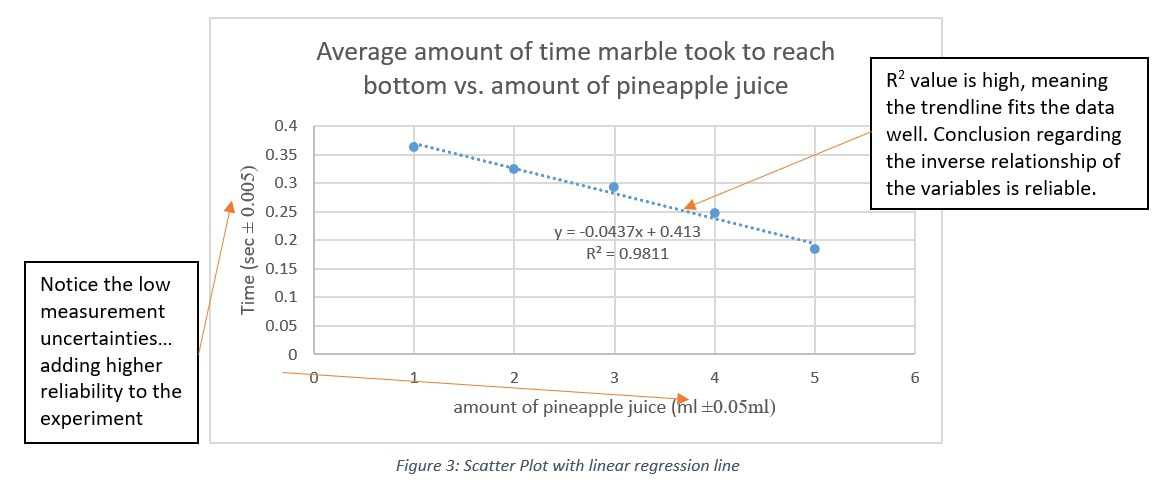
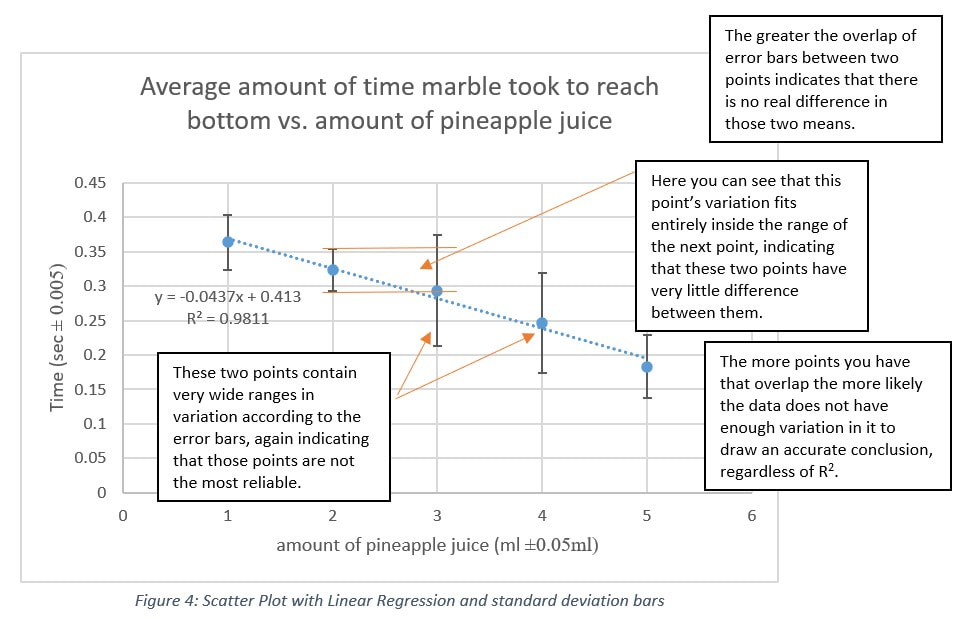
Analyzing the above graph: we can see the high R^2 value (0.98) meaning that this trendline has a significant fit to the data. So we can be confident that the "negative linear relationship" (as the amount of pineapple juice increases the time of the marble decreases) trend is an accurate and reliable description of the relationship between the two variables.The low measurement uncertainty also adds reliability to the numbers. These would have been appropraite to use as error bars if desired.
- Note that while stated in the analysis section, these should be discussed further in the evaluation section.
Error bars
"Error is the difference between the measured value and the ‘true value’ of the thing being measured. Uncertainty is a quantification of the doubt about the measurement result.
- Whenever possible we try to correct for any known errors: for example, by applying corrections from calibration certificates." - Stephanie Bell in "A Beginners Guide to Uncertainty in Measurement"
Error bars on a graph offer a way to visually see whether two points on a graph are significantly different. While it is not as statistically reliable as running an actual statistics test (T-test or ANOVA) it does give you a better indication of the reliability of your data and can offer insight into why your trendline may not fit the data as well.
- You can use measurement uncertainty as error bars, and this is appropriate if you do not have averages or you do not have enough points to accurately calculate standard deviation.
- Standard deviation generally needs at least 5 points to be accurate, but you can use 3, as long as you have calculated an average.
|
Analyzing the above information: While the above graph has a very good trendline (R^2 of 0.98) the error indicated with the standard deviation demonstrates overlapping data points.
|

|
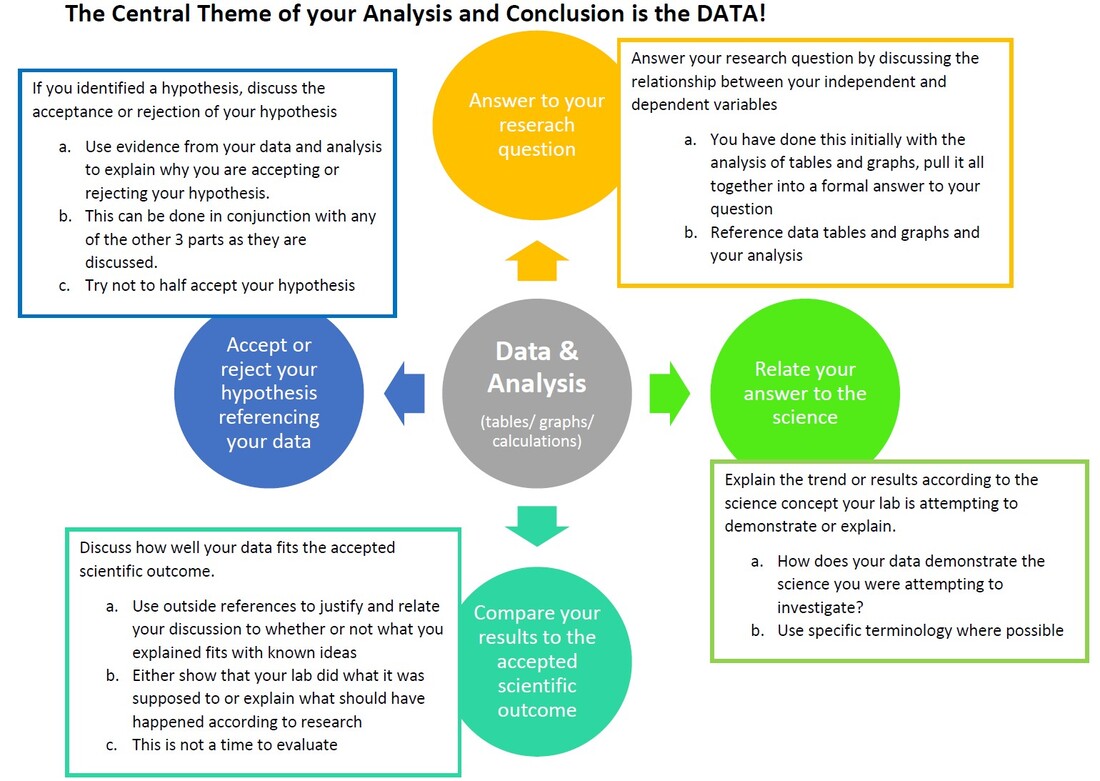
Conlcusion
Your conclusion should connect the Data with the research question, an answer to the hypothesis, AND the scientific context (ie the science of the lab) to each other.
- Explain the trends/ patterns you see in your graphs and tables (already idenfitied in analysis section, possible they were explained in the analysis, that is fine)
- Answer your research question based on that description!
- Use your analysis to explain the relationship between the indepdent and dependent variables. Relate to the graph, trends, and analysis.
- Accept or Reject your hypothesis (use the data to support your answer)
- It is ok to reject your hypothesis as long as you can explain why
- Reference graphs and tables here that bring connection to why you are accepting or rejecting the experiment.
- Explain what you saw and learned with the science you are trying to investigate. (THE WHY OF THE EXPERIMENT- why did it do this!)
- Use outside references and your background information to explain why the graph and data appear to draw the relationship they do.
- If it did not do what your reserach said it should, explain what it should have done and what is wrong with it! Reference outside materials
Evaluation
Evaluations focus on whether or not your conclusion can be trusted. It has two sections: 1) Discussion of the strengths and weaknesses/errors of your lab with improvements 2) Extensions to the experiment.
|
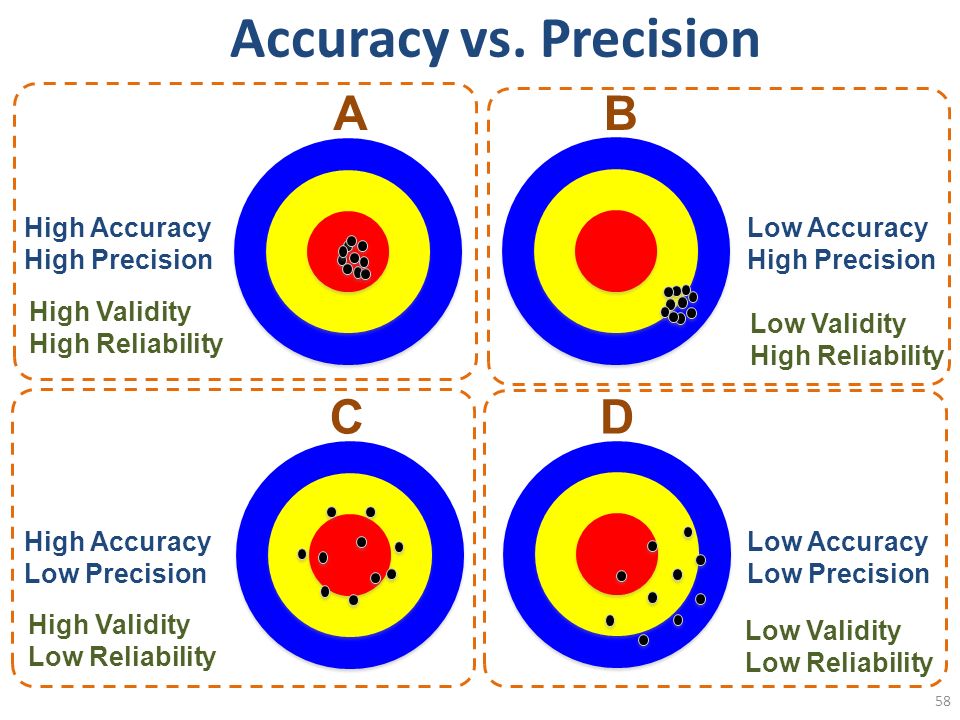
STRENGTHS AND WEAKNESSES:
Based off of your analysis & observations, discuss
|
https://cdn.pocketfives.com/p5wp/2017/11/594617-weak-strength.jpg
https://xpslibrary.com/wp-content/uploads/2019/07/Accuracyvs.PrecisionABCDHighAccuracyHighPrecision.jpg
|
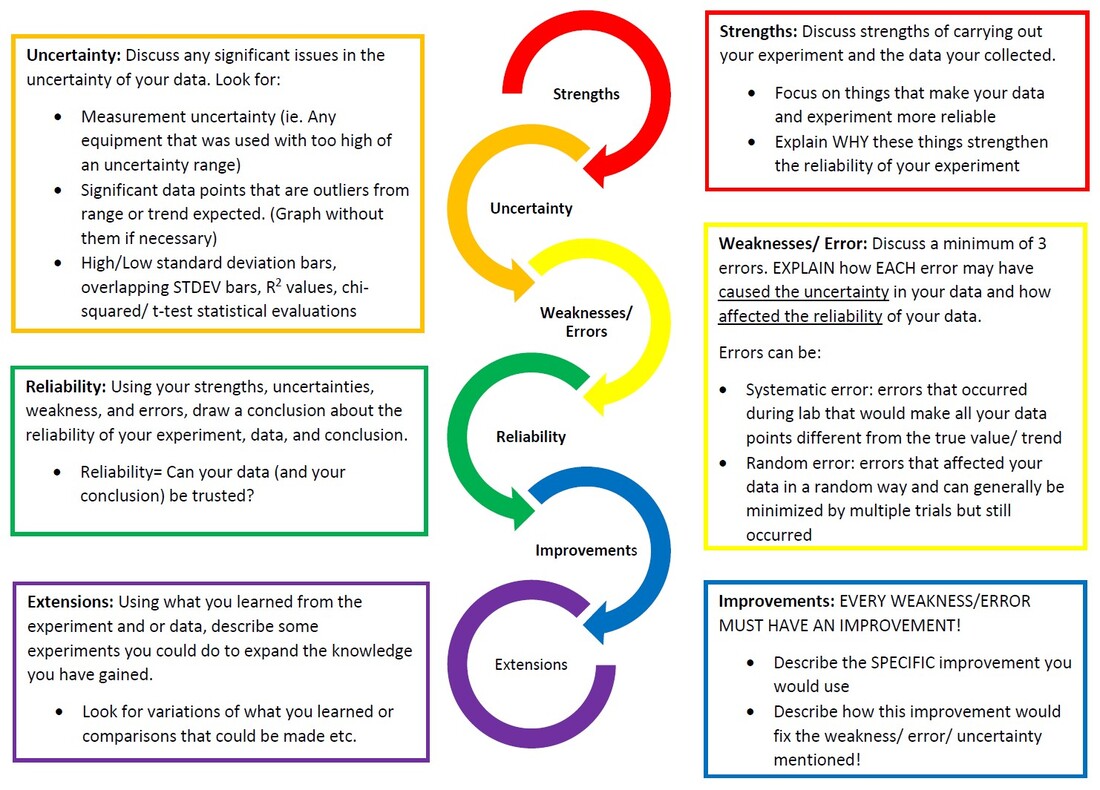
EXTENSIONS
Extensions are things that you would continue to research next time based on what you have learned now. Note that these are NOT improvments, they are expansions of your current question and answer.
Extensions are things that you would continue to research next time based on what you have learned now. Note that these are NOT improvments, they are expansions of your current question and answer.
- What else could you research?
- Different indepdent or dependent variables?
- What's a different experiment that would help to investigate a different aspect of what you discovered?
- What did you learn that you could reserach next or learn more about?
Bibliography
Cite your Sources!!Cite your sources. In-text citations should be present in the background information, hypothesis, and conclusion. A complete bibliography should be provided at the end of the report. Purdue Online Writing Lab is a great place for information on formatting of sources.
APA citation of a website with author:
|
What is Plagiarism?Plagiarism = using someone elses words or ideas without crediting the soure and passing them off as your own.
Plagiarism.org How do I know when and what to cite? - University of Arizona tutorial on Plagiarism |
Citation cites
|
While there are many fast sites that will make references for you, I'd recommend using Zotero.org. This allows you to create file folders for various projects and to connect directly to the web browsers.
|
|
